The retail inventory-to-sales ratio — total merchandise held by U.S. retailers divided by monthly sales, published by the Census Bureau — tells you how many months of demand sits on shelves and in warehouses. It ran near 1.30 to 1.35 for most of the decade before 2020: roughly five weeks of inventory across the sector. It then collapsed below 1.10 during the pandemic goods squeeze, spiked to about 1.35 again in 2022 when supply chains unsnarled into weakening demand, and forced the discount wave that hollowed retailers' 2022 margins. One decimal place, in both directions, moved billions in profit.
Here is how to read the series.
How is the ratio calculated?
Census divides end-of-month inventories at retailers by sales for the month, seasonally adjusted. Both inputs come from the same surveys that produce the monthly retail sales report, and the ratio is broken out by sector — motor vehicles, food and beverage, department stores, and the rest. Because the numerator is a stock and the denominator a flow, the ratio reads in months of coverage, and comparisons only make sense within the same retail sector: grocery runs a fraction of a month; auto dealers run around two.
Why did the pandemic break the ratio?
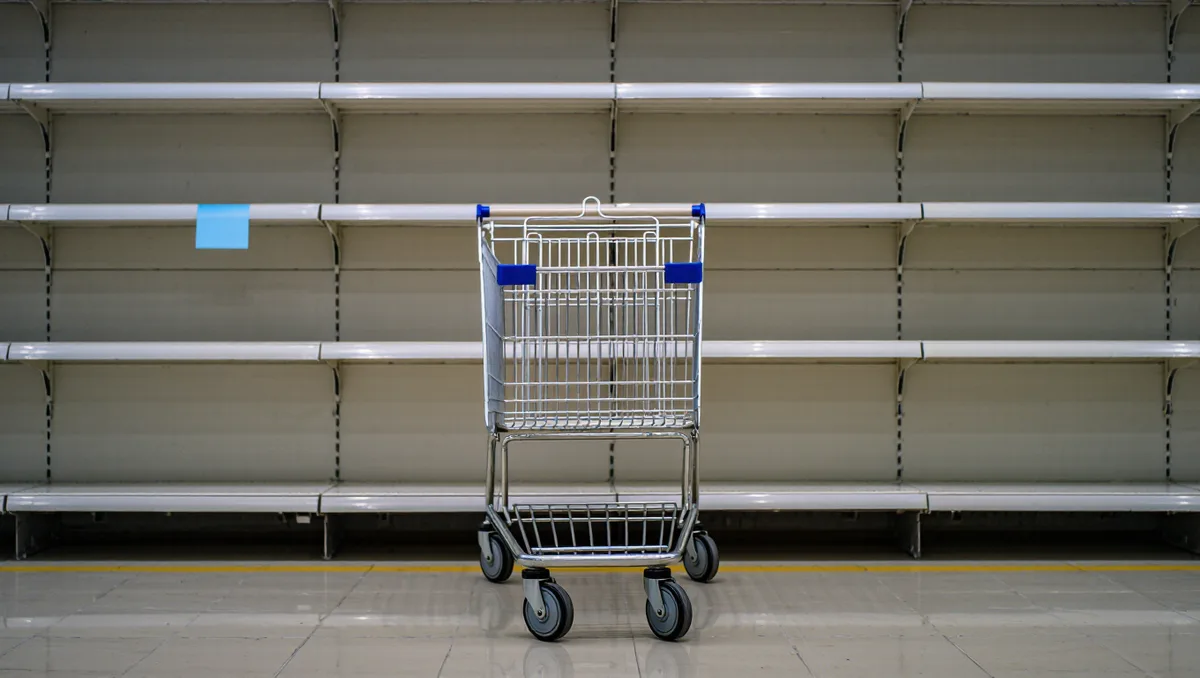
Goods demand surged while ports, factories, and trucking capacity did not. Inventories emptied faster than they could be replaced, pushing the ratio to record lows in 2021 — stockouts instead of sales. Retailers responded by over-ordering into 2022, and when goods demand normalized, the ratio snapped back above pre-pandemic levels. The correction required markdowns, and margins at general-merchandise retailers fell for consecutive quarters while the overhang cleared. The episode is the cleanest modern demonstration that the ratio punishes both extremes.
What does a rising ratio signal?
A persistent rise means sales are slowing relative to stock — demand weakness, over-ordering, or both. The typical chain of events: markdowns to clear goods, weaker gross margins for a quarter or two, then order cuts that upstream show up as factory orders and freight shipments falling. That is why analysts read the ratio together with rail carloads and container imports: rising inventories plus falling imports is a sector working off stock deliberately; rising inventories while imports also climb is a demand problem forming.
Why is the ratio structurally lower than it used to be?
The long pre-pandemic decline came from supply-chain management: just-in-time replenishment, better point-of-sale data, and distribution networks that let a store hold less because a warehouse nearby holds more. Retailers learned in 2021 that running lean has its own cost — empty shelves forfeit sales entirely — and several chains publicly shifted to holding more safety stock afterward. The durable post-pandium level has settled slightly above the 2019 floor, a deliberate trade of carrying cost for resilience.
Where do the numbers come from?
The series is published monthly with the Census Bureau's manufacturing and trade inventories and sales statistics, about six weeks after the month closes, in the MTIS tables. Watch the seasonally adjusted total-retail line, compare it to the same sector detail, and treat a two- to three-month trend as signal — single months are noisy.