Retail foot-traffic estimates — the "visits fell 4 percent year over year" lines in chain earnings coverage — come primarily from location-analytics firms: Placer.ai, Advan Research, and similar providers that collect anonymized smartphone location signals from apps, build panels of several million devices, and extrapolate visit counts to store addresses. The method powers a large secondary market in retail intelligence, sold to landlords, hedge funds, and the retailers themselves. Its virtue is speed — traffic reads weekly, ahead of any sales data. Its vice is that it is a sample with structure: who carries which apps, and who leaves location sharing on, is not the shopper population.
This explainer covers a private data industry.
How does the measurement work?
Apps embedded with location software-development kits transmit anonymized device coordinates; the provider clusters stops at a store's geofenced polygon and counts a "visit" when dwell time and frequency patterns fit. Panel counts are scaled to census-like population benchmarks — age, income, geography — to estimate total visits. dwell data yields conversion proxies (visit without purchase inferred from repeat behavior), trade areas, and cross-shopping: which other chains the same devices visit. Providers validate against retailer-reported counts where available and publish methodology summaries with accuracy claims in the low-single-digit percent error range under stable conditions.
What are the known biases?
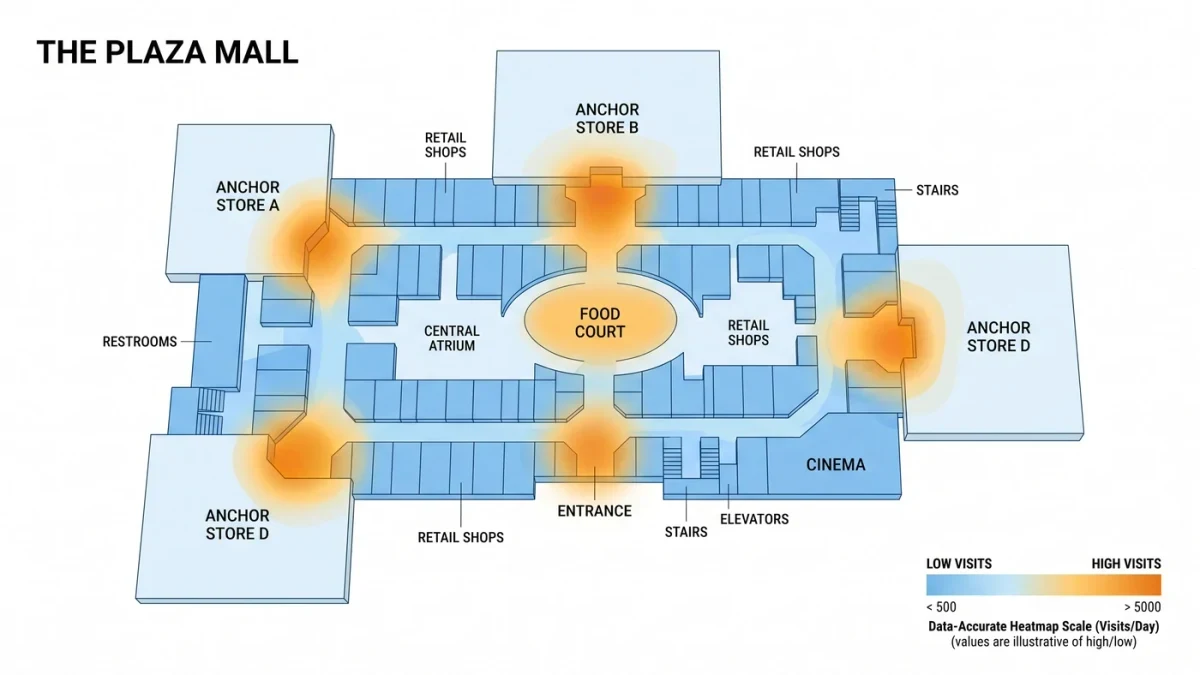
Panel composition first: location-sharing consent skews younger and more urban, so scaling corrections carry the weight of the bias. Device duplication, family sharing plans, and in-car versus in-store stops all misclassify at the margin. Geofencing error at malls and mixed-use buildings — attributing a visit to the wrong anchor — is a documented weakness. And the pandemic-era shocks permanently altered the relationship between traffic and sales: BOPIS pickups count as visits without basket browsing, so chains with curbside programs show traffic patterns decoupled from the shopping that once meant.
Who uses the data and how well does it predict?
Landlords use it for leasing and rent negotiation; investors use weekly traffic as a pre-earnings signal, and academic backtests confirm real predictive content for quarterly revenue at the margin. But the signal is noisy — weather, holiday calendar shifts, and local events move single weeks — and the strongest readings come from sustained multi-week divergences between a chain's traffic and its category's. Placer.ai's public reports became a fixture of retail earnings coverage in the 2020s, with the standing caveat that the firm sells to the companies it measures.
How does it compare with official data?
The Census Bureau publishes nothing on visits; the official chain-level facts are monthly retail sales by category and companies' own disclosed same-store sales and transaction counts, quarterly. Traffic data leads those by weeks but estimates a different object — bodies through doors, not dollars through registers. The correct calibration: traffic tells you interest and catchment health; the sales reports tell you what the traffic did once inside.
What should readers check before quoting a traffic number?
Three things: the panel and scaling method (published in methodology notes), the comparison window (year-over-year with a calendar caveat), and whether the provider's commercial relationship with the named chain could shape the release. A single week is weather; a quarter is a trend; and even the trend is an estimate of visits, not a census of shoppers.