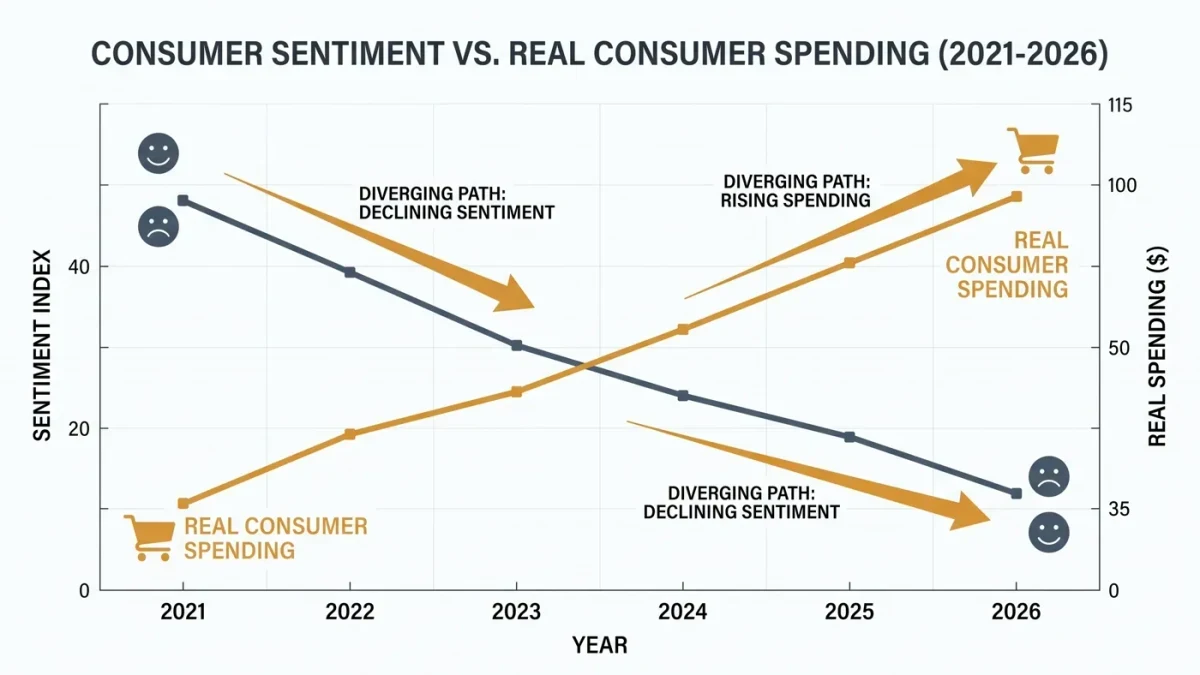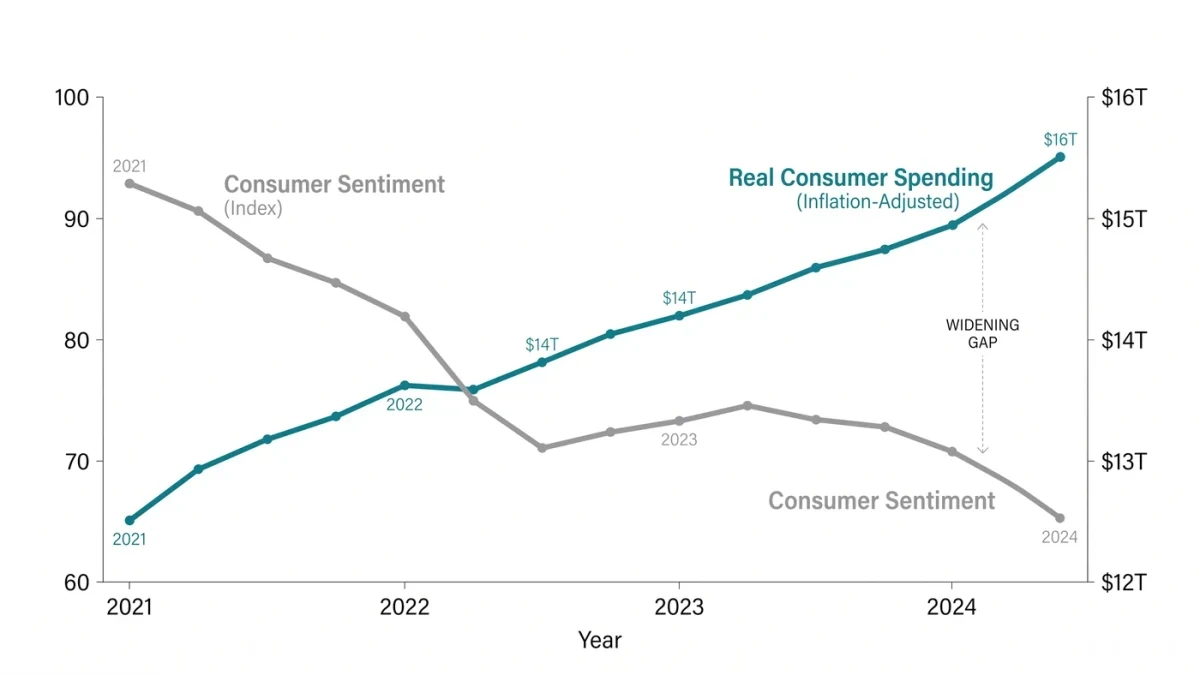
The two main U.S. confidence measures — the Conference Board's Consumer Confidence Index and the University of Michigan's Surveys of Consumers — ask households how they feel about the economy, and both fell hard in 2022 while actual consumer spending, measured monthly by the Census Bureau, kept growing. The gap became the cycle's defining fact: through 2022–2025, sentiment readings sat at or below recession-era levels while real consumption rose quarter after quarter. Confidence surveys describe the household's mood; spending data describe its behavior. In the 2020s, the divergence between them ran wider and longer than at any point since the series began.
The Daily News 24 publishes information, not investment or policy advice. This explainer compares official and survey series.
What do the surveys actually measure?
The Conference Board survey, monthly since 1967, weights present conditions and expectations into one index, with a labor-market component that tracks job availability. Michigan's survey, running since 1946, emphasizes expected personal finances and inflation expectations — its long-run inflation expectation series is quoted in Fed commentary. Both are samples of a few thousand households, both are revised modestly, and both correlate with gasoline prices and political affiliation in ways their designers document: partisan gaps in economic sentiment widened sharply after 2016 and 2020, with identical conditions producing different answers by party.
Why does sentiment diverge from spending?
Because spending is constrained by income and balance sheets, and mood is not. As long as employment and real income hold, consumption continues regardless of what households tell surveyors — the 2023–2025 pattern exactly: gloomy readings, solid real wage growth as inflation fell, unemployment near 4 percent, spending up. The reverse also holds: confidence can run hot while balance-sheet stress (debt service, depleted savings) forces spending down — the setup some 2025 analyses flagged as excess savings from the pandemic fully depleted and delinquencies rising on cards and autos. The survey tells you feelings; the Flow of Funds and employment reports tell you capacity.
When does confidence predict anything?
At extremes and in changes: collapsing expectations have preceded recessionary spending pullbacks when confirmed by income data, and Michigan's inflation expectations have had real policy weight — the 1970s taught the Fed that unanchored expectations become self-fulfilling, which is why the series is watched even when its level looks politically skewed. The research consensus: sentiment adds forecasting value for spending at the margin, mostly through its expectations components, but income and wealth variables dominate. The practical hierarchy for predicting consumption: jobs first, income growth second, balance sheets third, confidence a distant fourth.
How should readers read a sentiment headline?
Three calibrations. Compare the index to its own decade range, not its all-time range — a 1980 base means little at 2020s levels. Separate present conditions from expectations; the expectations component is the volatile, political one. And check the confirmation: a confidence drop with rising claims and falling retail sales is a signal; a confidence drop alone is a mood, and the 2022–2025 experience says moods can persist for years without ever reaching the cash register.
What did this cycle settle?
That "consumer sentiment is a coincident indicator of the news cycle" is closer to the data than the legacy textbooks' treatment of it as a leading indicator of spending. The consumer that matters for GDP is the one in the payroll and credit data. The one in the survey is talking — worth hearing, rarely worth forecasting by.