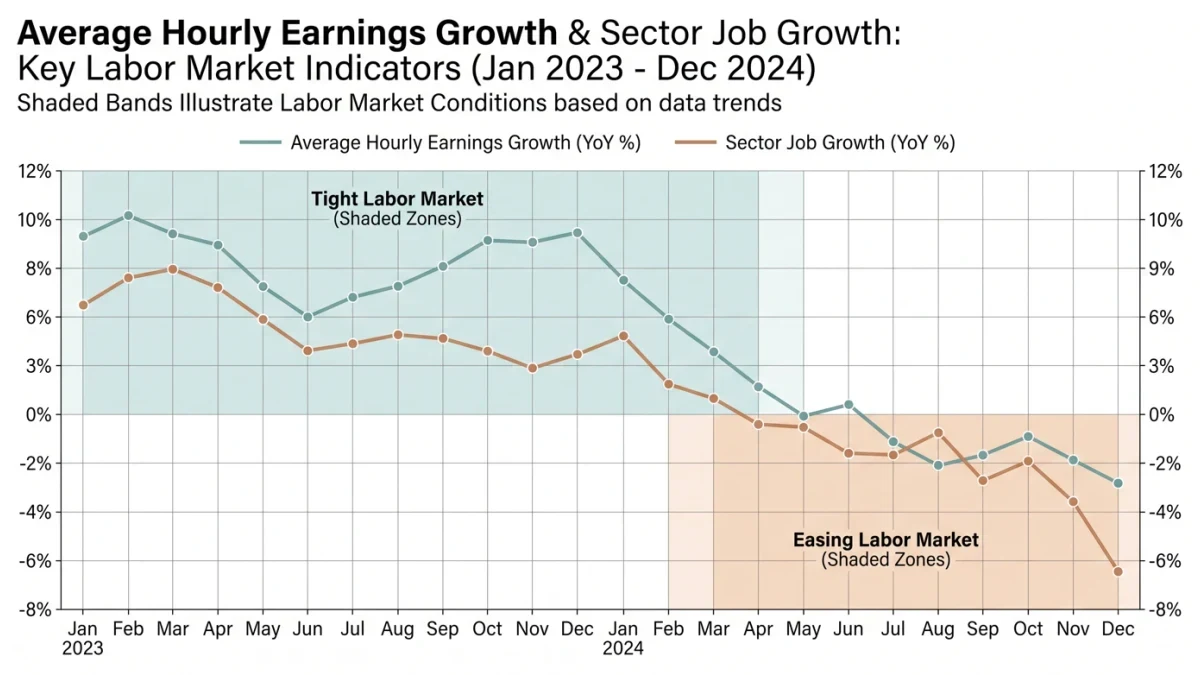
The Employment Cost Index (ECI) is a quarterly measure of the cost of labor to employers, published by the Bureau of Labor Statistics, that tracks changes in wages, salaries, and benefits while holding the mix of jobs constant. Unlike average hourly earnings, which can swing simply because more high-paid or low-paid jobs were added in a given month, the ECI compares the same occupations and industries across quarters, so a rise in the index means pay for the same work is rising. The Federal Reserve has repeatedly flagged the series as its preferred wage-inflation gauge for exactly that reason.
The Daily News 24 publishes information, not investment or policy advice. Here is how the index is built and how to read the next release.
How is the Employment Cost Index calculated?
The BLS samples thousands of private-industry establishments, as well as state and local governments, and records pay for specific job categories — an accountant in manufacturing, a cashier in food service — rather than for the workforce as a whole. Each quarter it asks what that job is paid now, converts wages and salaries plus benefit costs into an index, and reports the change. Because the occupation mix is fixed, the ECI filters out the composition effect that distorts headline earnings figures during recessions and recoveries, when the kinds of jobs being added shift sharply.
Wages and salaries vs. total compensation: which number matters?
The release gives two headline figures: wages and salaries alone, and total compensation including benefits. Benefits — health insurance above all — tend to move differently from cash pay and can lag it by quarters. In tight labor markets, benefit costs frequently accelerate after wages do, because insurance renewals are annual. Analysts watching underlying inflation pressure usually watch both: cash pay for the current signal, total compensation for the fuller cost to employers.
Why does the Fed watch the ECI so closely?
Monetary policy works with lags, and wages are both a cost to firms and an income to households. Rapid wage growth that outruns productivity raises unit labor costs, which firms eventually pass into prices — the wage-price channel the Fed must judge when setting rates. In its post-2021 tightening cycle, the FOMC cited slowing ECI readings as evidence that labor-market overheating was easing. A rule of thumb used by Fed economists and street analysts alike: ECI growth near the pre-pandemic pace of roughly 2 to 3 percent a year is consistent with the 2 percent inflation target, given trend productivity; readings far above it signal persistent wage pressure.
What are the index's limits?
The ECI excludes self-employment, farm payrolls, and federal government workers, and — by design — it ignores the pay a job would need to attract a new hire today. It measures the cost of the same job over time, not the market clearing price of labor at the margin. It also moves slowly: quarterly publication means the signal arrives with a lag of several weeks after the quarter closes, and revisions, while usually small, do occur.
When is it released and where?
Publication falls in the last week of January, April, July, and October, covering the prior quarter, on the BLS website with full tables. The single most-watched line is the year-over-year change in private-industry wages and salaries; a full point of acceleration or deceleration across two quarters is the kind of move that shifts rate expectations.
For readers tracking whether pay is finally outrunning prices, the practical drill is constant: pull the ECI release, compare year-over-year wage growth with CPI inflation for the same period, and remember the index's core virtue — it is one of the few series where the answer cannot be produced by the mix of jobs changing underneath it.