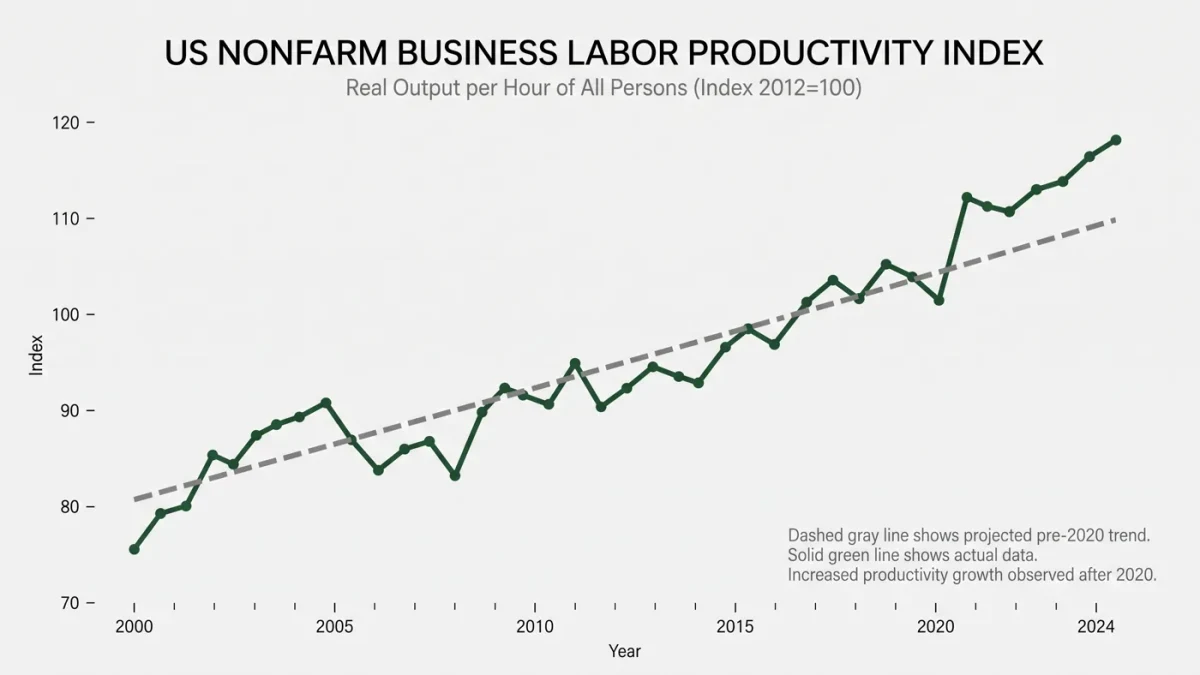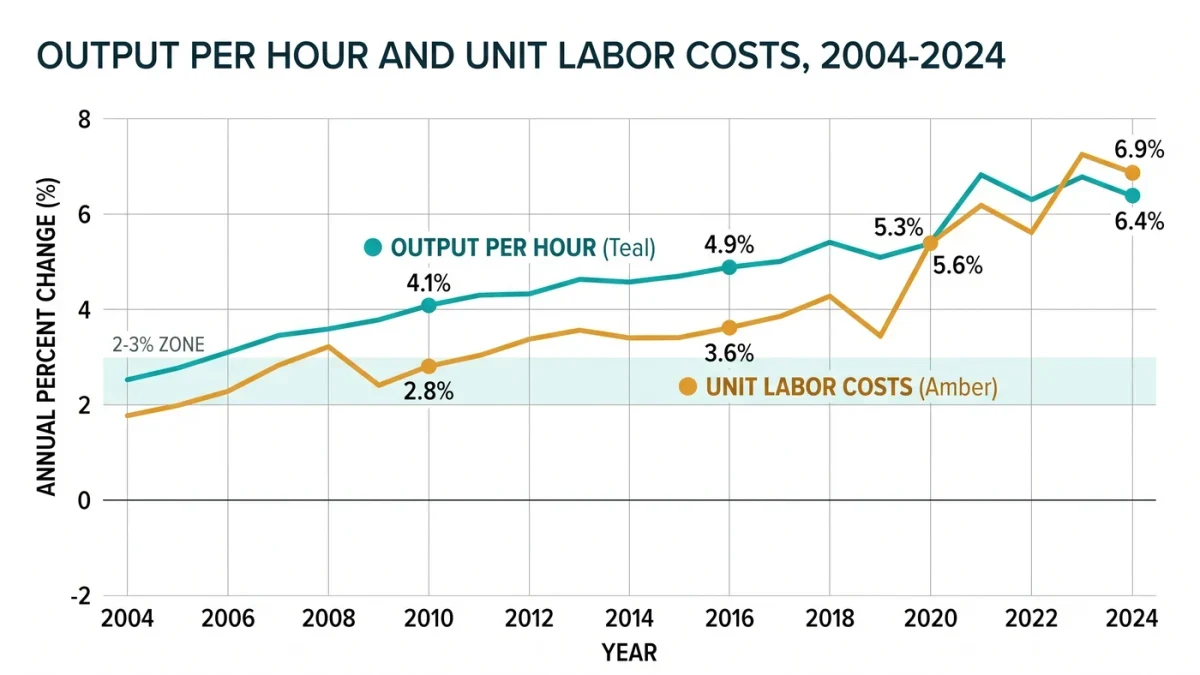
Nonfarm business sector productivity, published quarterly by the Bureau of Labor Statistics, divides real output by hours worked — how much an hour of American labor produces. Its companion, unit labor costs, divides total compensation by output: what labor costs per unit produced. The pair answers the central inflation question: if wages rise 4 percent and productivity rises 2 percent, unit labor costs rise 2 percent and prices need not; if productivity is flat, the same wage growth must come out of margins or prices. That arithmetic is why Fed commentary tracks these two series alongside the inflation data itself.
The Daily News 24 publishes information, not investment or policy advice. This explainer covers two official series.
How are the series constructed?
Output comes from BEA's measure of real gross domestic product for the nonfarm business sector; hours from the BLS payroll and household surveys; compensation from wage data including benefits. Productivity is output per hour; real compensation per hour deflates pay by the sector's output price; unit labor costs are nominal compensation per hour divided by productivity. Because the inputs are the GDP accounts, the series inherits their revision cycle — early productivity prints move materially, and both quarters of 2020 were statistical chaos.
Why does productivity matter so much for living standards?
Over decades, real compensation cannot outgrow productivity by much — employers pay wages from output. The post-1973 divergence, where productivity grew faster than real median pay, is the exception economists debate: measurement of benefits, composition of the workforce, and declining labor share each explain part of it. Conversely, the strong productivity readings of 2023–2024 — annualized gains that ran well above the tepid 1.4-ish pre-pandemic trend for several quarters — let the economy absorb wage growth near 4 percent with falling inflation, the soft-landing combination the Fed's own speeches cited.
What do unit labor costs signal?
ULC growth consistent with 2 percent inflation is roughly productivity growth plus 2 percent — around 3 to 3.5 percent historically. Sustained readings above that imply pressure on margins or prices; declines, like 2024's negative quarters at times, imply the disinflation had a labor-cost engine. The series is volatile quarter to quarter and dominated by the productivity denominator in short windows, so the four-quarter average is the usable signal.
Why is productivity so hard to measure now?
The measured series excludes hard-to-count gains: free digital goods, quality adjustments in new products, and intangible investment that lands in GDP late. The mismeasurement debate flares whenever the data disappoint — the productivity slowdown of 2011–2019 prompted an extensive literature arguing part of the slowdown was statistical. The honest position: the series is the best available measure of a concept the statistics only approximate, and its medium-term trend has repeatedly surprised in both directions.
How should readers track it?
The BLS releases productivity and costs quarterly, about five weeks after the quarter, revised with the GDP data. Watch three lines together: output per hour's four-quarter trend versus the pre-pandemic norm, real compensation per hour, and unit labor costs against the 3-percent comfort line. When productivity accelerates, wage growth that looks hot becomes sustainable; when it stalls, benign wage numbers turn inflationary. Few single statistics carry that much interpretive weight.