Dividend yield — annual dividends per share divided by price — states the cash return at today's price; the S&P 500's yield has run near 1.3 to 1.5 percent in the mid-2020s, historically low because valuations are high and buybacks deliver the return instead. Dividend growth — the rate at which the payout increases — is the compounding engine: a stock yielding 2 percent that raises its dividend 10 percent annually pays a yield-on-cost of over 5 percent within a decade, while a static 6 percent yield pays the same 6 percent forever, if it holds. The two numbers trade off mechanically, because a fast-growing payout rarely starts high.
This explainer covers dividend mechanics.
What is a yield trap?
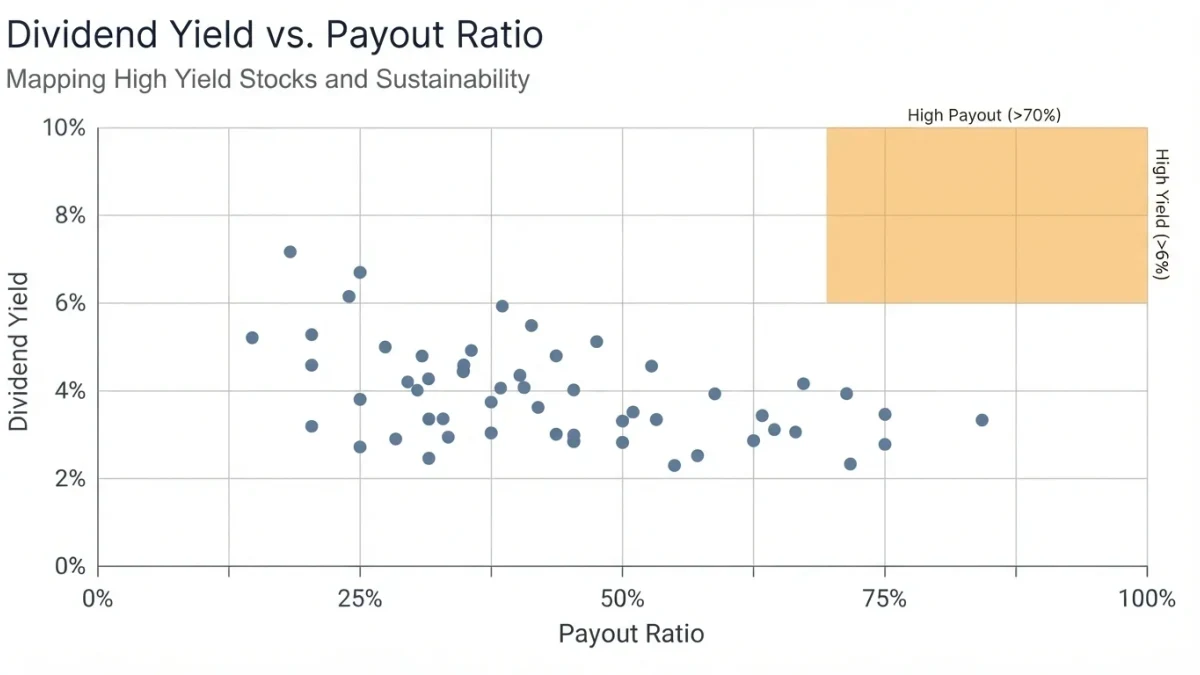
A high yield that the payout cannot sustain: the price has fallen because the market expects a cut, leaving the trailing dividend divided by a distressed price printing an attractive number. The classic screens: payout ratio above earnings or free cash flow, declining revenue funding a rising payout, and yield far above the sector norm. The 2015–2020 energy and telecom cycles cut through famous high-yielders when distributions exceeded cash generation. The discipline is cash coverage: dividends paid against free cash flow after capital expenditure and maintenance, the number from which boards actually set payouts.
What is dividend growth investing?
Selecting for firms that raise dividends consistently — the S&P Dividend Aristocrats, companies with 25-plus consecutive years of increases, being the canonical list. The logic: a sustained raise requires boards to commit recurring cash against future earnings, an information-rich signal about confidence; cuts are punished brutally by the market, so boards guard the streak. Evidence on whether dividend-growth portfolios beat the market is mixed — factor research attributes much of the performance to quality and profitability tilts rather than dividends per se — but the cash-flow arithmetic of growing payouts is arithmetic regardless of factor debates.
What are the key dates?
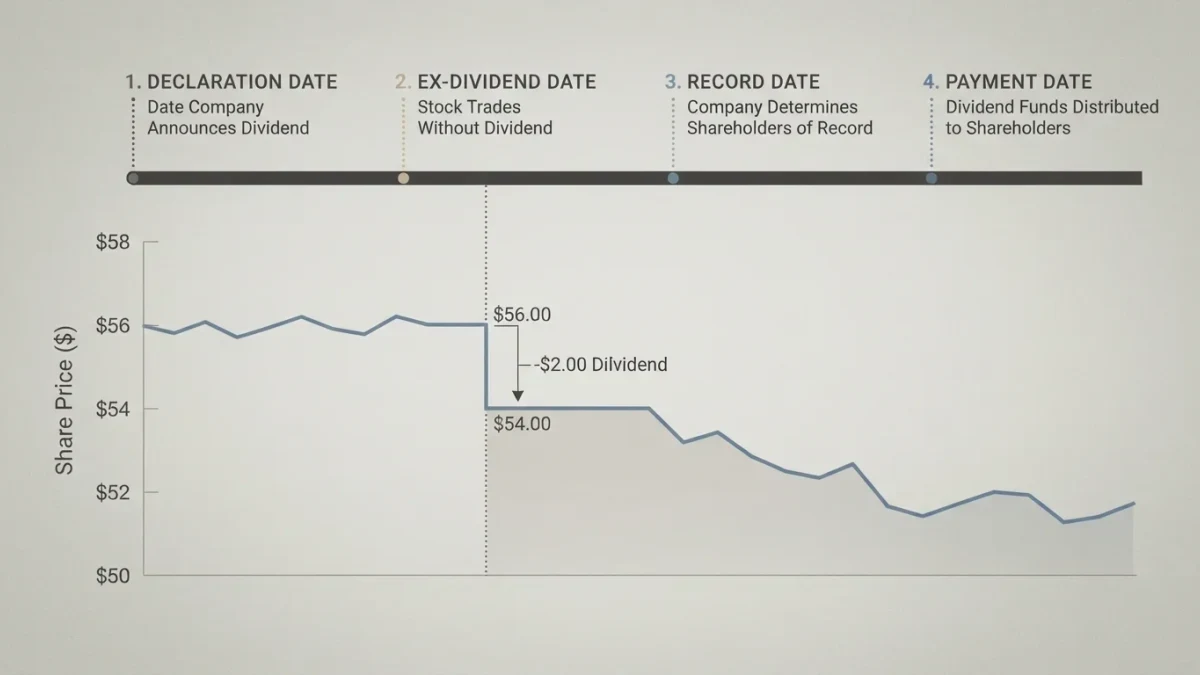
Declaration date, when the board announces the amount; record date, when holders of record are identified; ex-dividend date, typically one business day before record under the T+1 settlement regime adopted in 2024, when the stock trades without the dividend — buying on or after the ex-date does not receive it; and payment date. Prices tend to drop by roughly the dividend amount at the ex-date open, which is why chasing a stock for its dividend the day before the ex-date captures nothing.
How do dividends and buybacks interact?
As total-payout complements: dividends are the sticky commitment, buybacks the flex. A firm with a 1.3 percent yield and a 3 percent buyback yield is returning over 4 percent of market value annually — the total shareholder yield that compares across eras and markets. The composition also matters for taxes and signaling: buybacks are discretionary, dividends are promises, and boards that hold dividends flat while buying back aggressively are signaling exactly what that combination signals.
What should readers check before trusting a yield?
Cash coverage first — payout versus free cash flow; then the growth history — a decade of raises is a track record, two years is weather; then the balance sheet — dividends funded by borrowing end the way all borrowed commitments do. The yield is a snapshot; the growth rate and its funding are the story.