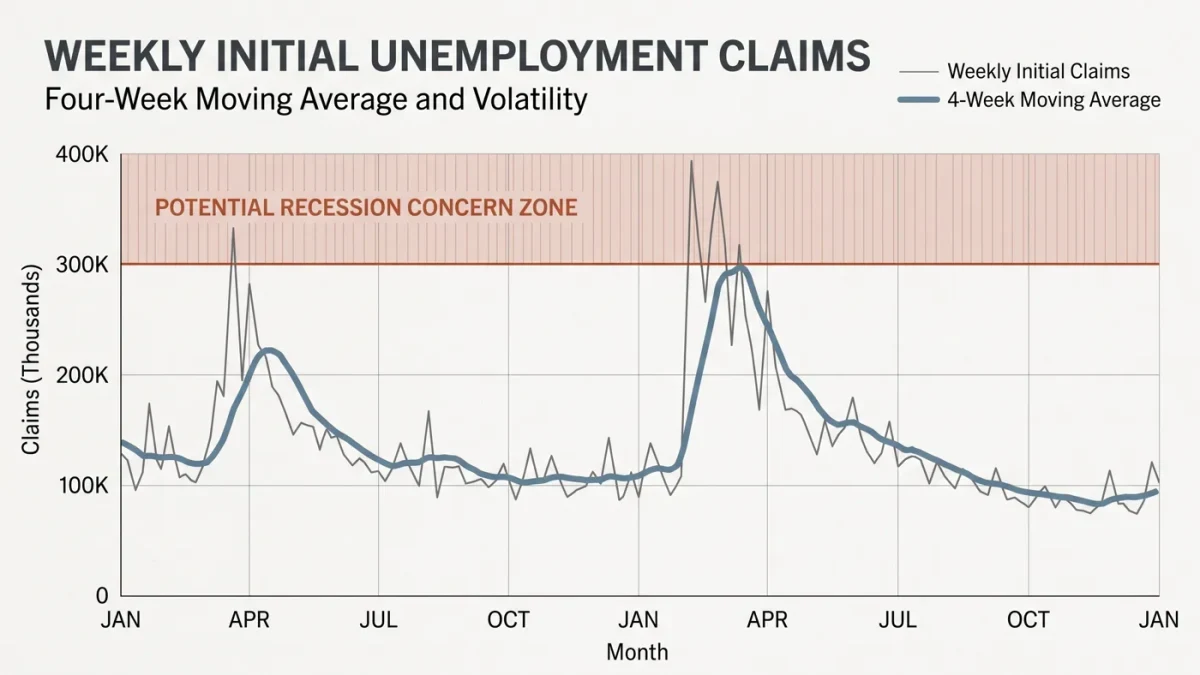
Initial unemployment insurance claims — about 200,000 to 260,000 in a normal recent year — count people who newly applied for jobless benefits in a given week, making the Department of Labor's Thursday release the fastest official read on the labor market. The unemployment rate, published monthly by the Bureau of Labor Statistics from household-survey data, measures the share of the labor force without a job but actively looking. One is a flow of new layoffs reported within days; the other is a stock of joblessness measured across a whole month. Confusing the two is the most common error in reading labor data.
What exactly do initial claims count?
Only people who qualify for and file for state unemployment insurance — roughly 96 percent of U.S. workers are covered by state or federal programs. They exclude self-employed gig workers not enrolled in federal extensions, people who left jobs voluntarily, new entrants to the workforce, and those laid off but not filing. Continuing claims, the companion series, count everyone still drawing benefits and rise when the unemployed take longer to find work — a hiring signal, not a firing one.
Why does the unemployment rate tell a different story?
The household survey behind the unemployment rate captures everyone the claims data miss: job quitters, re-entrants, new graduates, and discouraged workers. But it is a survey of about 60,000 households with sampling error of a few tenths of a percentage point, and it can move for labor-force-size reasons rather than job loss. In 2024–2025, the rate's rise in several months came from participation growing faster than hiring — people entering the labor force and counted as unemployed while searching — even as claims stayed low and payroll growth stayed positive.
Which series leads and which lags?
Claims lead. A sustained break above the recent trend — the kind of move that held above 250,000 for weeks — historically appeared near the start of recessions, including in 2008 and 2020, because layoffs spike early in a downturn. The unemployment rate lags: it keeps rising after recessions end while re-entrants search. The Sahm rule, a formalized version of this logic, flags recession onset when the three-month average unemployment rate rises half a percentage point above its trailing twelve-month low; it triggered in mid-2024 without a recession following, the latest reminder that thresholds are indicators, not switches.
How should you read the weekly number?
Four adjustments matter. Seasonal adjustment is imperfect around holidays and plant retooling weeks in July, when auto-industry shutdowns distort raw filing counts. Big one-week spikes are often state-level processing backlogs. The four-week moving average filters the noise. And the level matters relative to trend, not in isolation: in the mid-2020s cycle, economists treated the 230,000–260,000 band as consistent with a stable labor market, while a move sustained above 280,000–300,000 would mark a genuine deterioration. Those bands shift with labor-force growth and are rules of thumb, not official thresholds.
Where do the releases land?
Claims come every Thursday morning from the Employment and Training Administration; the unemployment rate lands on the first Friday of most months with the employment situation report. Reading both together — the weekly flow of layoffs, the monthly stock plus participation — gives the picture neither series supplies alone.