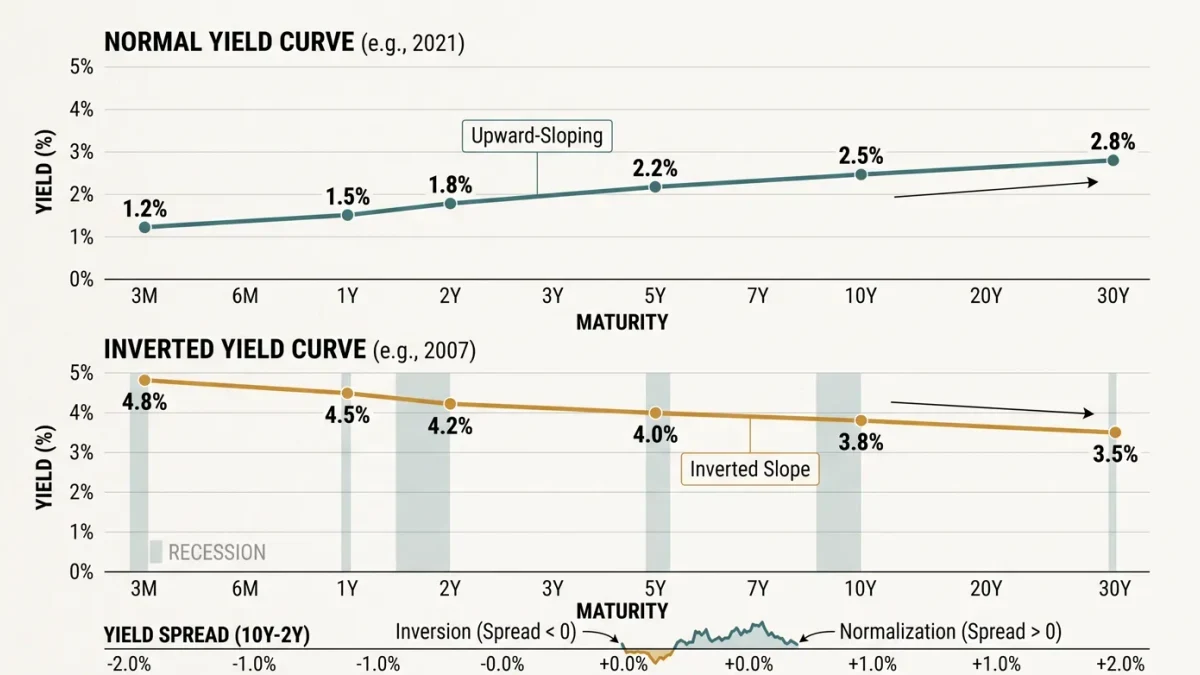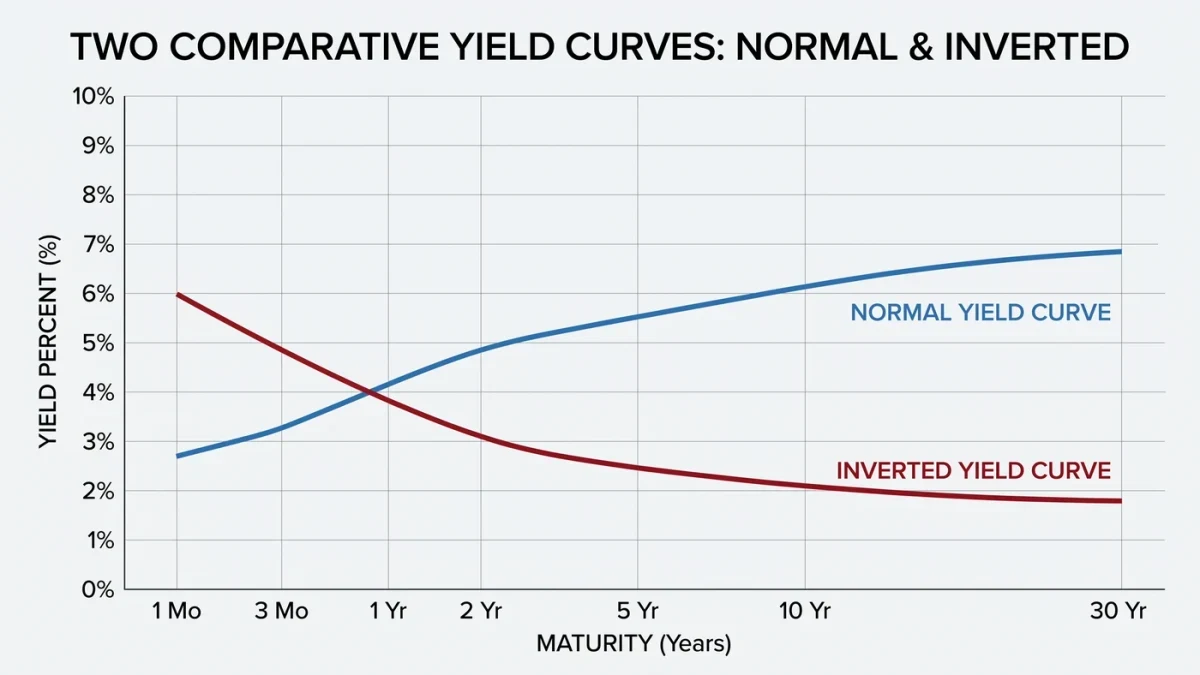
The yield curve is the set of interest rates the U.S. Treasury pays across maturities, from 1-month bills to 30-year bonds, and its most-watched slice — the spread between the 10-year note and the 3-month bill — has turned negative before every U.S. recession since the 1960s for which daily data exist. An inverted curve means lenders earn less for locking money up for years than for weeks, a condition that compresses bank margins, tightens credit, and historically has appeared six to twenty-four months before a downturn begins. The New York Fed maintains a recession-probability model built largely on this spread.
Why does an inversion point to trouble?
Long-term yields normally sit above short-term ones because investors demand compensation for inflation risk and for giving up access to their money. Inversion typically appears when the Federal Reserve pushes short rates up to fight inflation while the market expects growth, inflation, and eventually policy rates to fall. Banks then borrow short and lend long at a loss on new loans, credit standards tighten, and the financing that funds expansion gets scarcer. That transmission — not the curve itself — is the mechanism behind the signal's record.
How good is the signal, really?
Every recession, but not every inversion: the curve inverted in 1966 with no recession following. Timing is the larger problem. The lead time has ranged from roughly six months to two years, which makes the signal close to useless as a trading or planning calendar on its own. The 2022–2024 episode stretched the pattern further — the 10-year/3-month spread stayed deeply negative for a record stretch without the recession most forecasters expected following it, a reminder that a strong historical base rate is not a law.
What does uninversion mean?
Recoveries of the spread get less attention but matter more. Curves usually uninvert not because long yields rise but because the Fed cuts short rates as the economy weakens — so the end of an inversion has often arrived alongside the downturn itself, not before it. Analysts watching the 2024–2026 cycle tracked exactly this: as the FOMC lowered its target range from its 2023–2024 peak, spreads normalized from deep negative territory, reviving the debate over whether the normalization was a soft-landing signal or the historical late-cycle one.
Which spread should you watch?
The New York Fed's model uses the 10-year/3-month term spread; the older rule of thumb used the 10-year/2-year. They usually agree, but the 3-month version captures the steepest part of the policy transmission and is the one tied to the published recession probabilities. Far-forward spreads — subtracting expected average short rates implied by derivatives — are the Fed's own preferred gauge of policy expectations, and they invert less often.
Where do the numbers come from?
Yields are published daily by the U.S. Treasury and traded levels are available from the Chicago Mercantile Exchange; the New York Fed updates its recession-probability model monthly. A practical reading habit: note the spread's sign, its depth in basis points, and whether any move comes from the long end or the short end — the source of the change tells you whether markets are repricing growth or repricing the Fed.
The curve is a base rate, not a forecast. It compresses what the bond market expects about growth and policy into one number, and its track record earns attention — while its timing record demands patience.