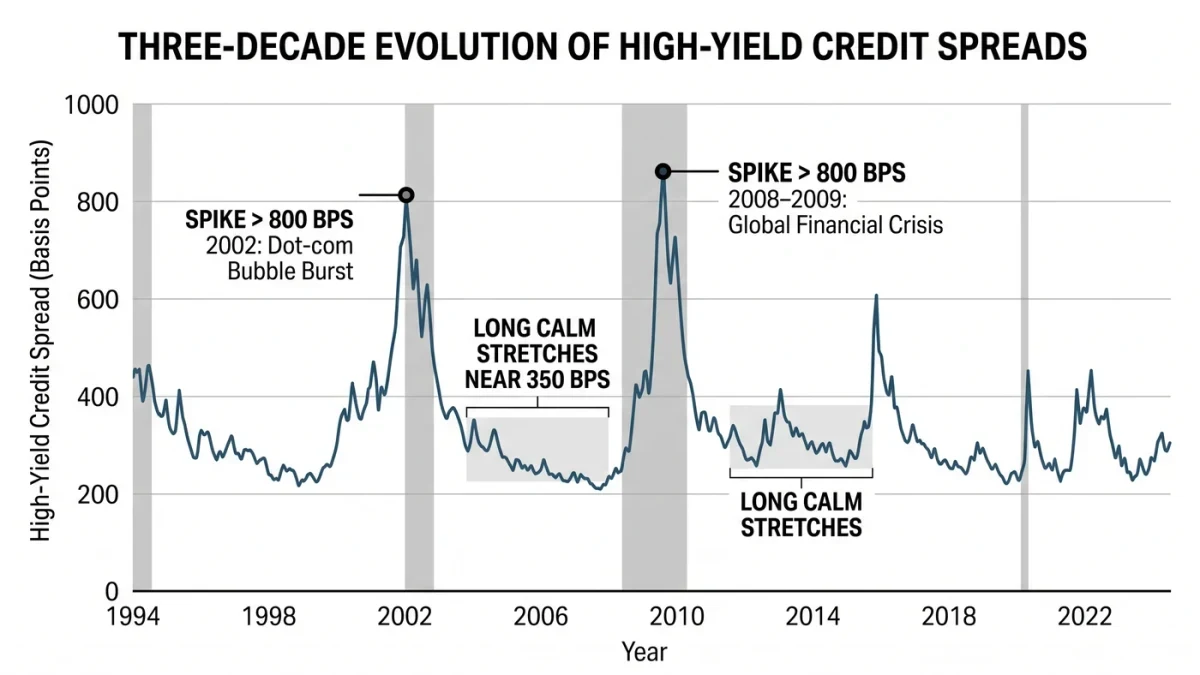
A credit spread is the extra yield a corporate bond pays over a Treasury of similar maturity — compensation for default risk, seniority, and illiquidity. Investment-grade spreads have averaged roughly 100 to 130 basis points in calm decades; high-yield spreads around 300 to 450. The indicator's reputation comes from timing: high-yield spreads widening decisively above 500 basis points has preceded or accompanied every modern recession, and in 2007 the high-yield market broke months before equities made their final highs — the credit market's version of noticing the plumbing failing first. Equities price growth; credit prices survivability, and survivability deteriorates earlier.
This explainer covers a market indicator.
Which spreads should you watch?
The workhorse indices are the ICE BofA US High Yield Master II option-adjusted spread for speculative grade and the corresponding investment-grade index, both published daily by FRED with option-adjustment that strips out embedded call features. Single-name credit default swaps on individual issuers give the granular read; the CDX index families aggregate them into tradable benchmarks. Distress ratio — the share of high-yield bonds trading above 1,000 basis points over Treasuries — is the companion statistic, and its rises from near zero have historically been a clean early warning.
Why does credit lead equities?
Two mechanisms. Information: credit investors are paid a fixed coupon, so their research concentrates on downside — leverage, covenants, refinancing walls — rather than growth stories, and refinancing stress shows in spreads long before it shows in earnings. Structure: a company can service debt at current rates but face a wall at maturity, so spreads price the roll-over risk years ahead, while the equity holds its narrative until the cash actually runs short. The asymmetry is documented across cycles: the 2015–2016 energy bust widened high-yield above 800 basis points without a national recession — the false positive — while 2007 and 2019's repo-era wobbles were caught by credit first.
What are the failure modes?
False positives: energy-driven widenings in 2015–2016 and the 2022 rate-shock widening — high-yield spreads gapped above 600 basis points with defaults staying low, because the stress was rate repricing, not credit deterioration. Structural distortion: central-bank corporate bond purchases compressed European spreads to levels that carried no information; index composition — the high-yield index is now quality-heavier than in the 1990s, so spread levels are not comparable across eras — and the fallen-angel effect shifts the population between indices mechanically. As always, the change and its cause beat the level.
How did spreads behave in the 2023–2026 cycle?
Tight through it all: high-yield spreads spent 2024–2025 in the low-300s, near two-decade tights, while policy rates sat restrictive — the market pricing a soft landing with a refinancing calendar stretched by issuers having termed out debt at 2020–2021 lows. The known vulnerability, flagged by Fed financial-stability reports throughout: the maturity wall arriving later in the decade forces refinancing at higher coupons, raising the default baseline even without a recession. Bulls read tight spreads as confirmation; critics read them as compensation too thin for the tail — both read the same number.
How should readers use them?
Watch the direction and the driver: widening driven by rate volatility (Treasury selling) is different from widening driven by issuer-specific defaults; the latter is the recession-relevant signal. Pair spreads with the distress ratio and with bank lending standards from the Fed's senior loan officer survey — credit tightening across two of the three has preceded every downturn, and the combination is the honest practical rule.